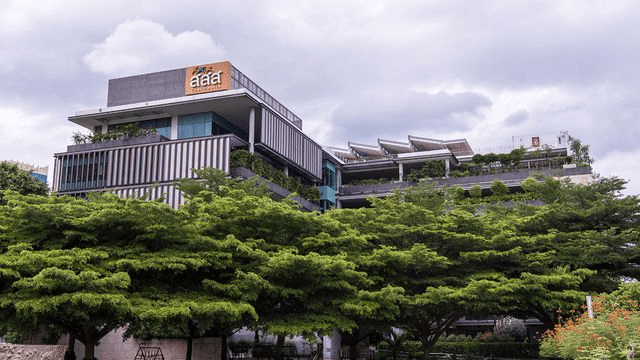
Driving Sustainability Through Data: Thai Health Promotion Foundation's Smart Dashboard
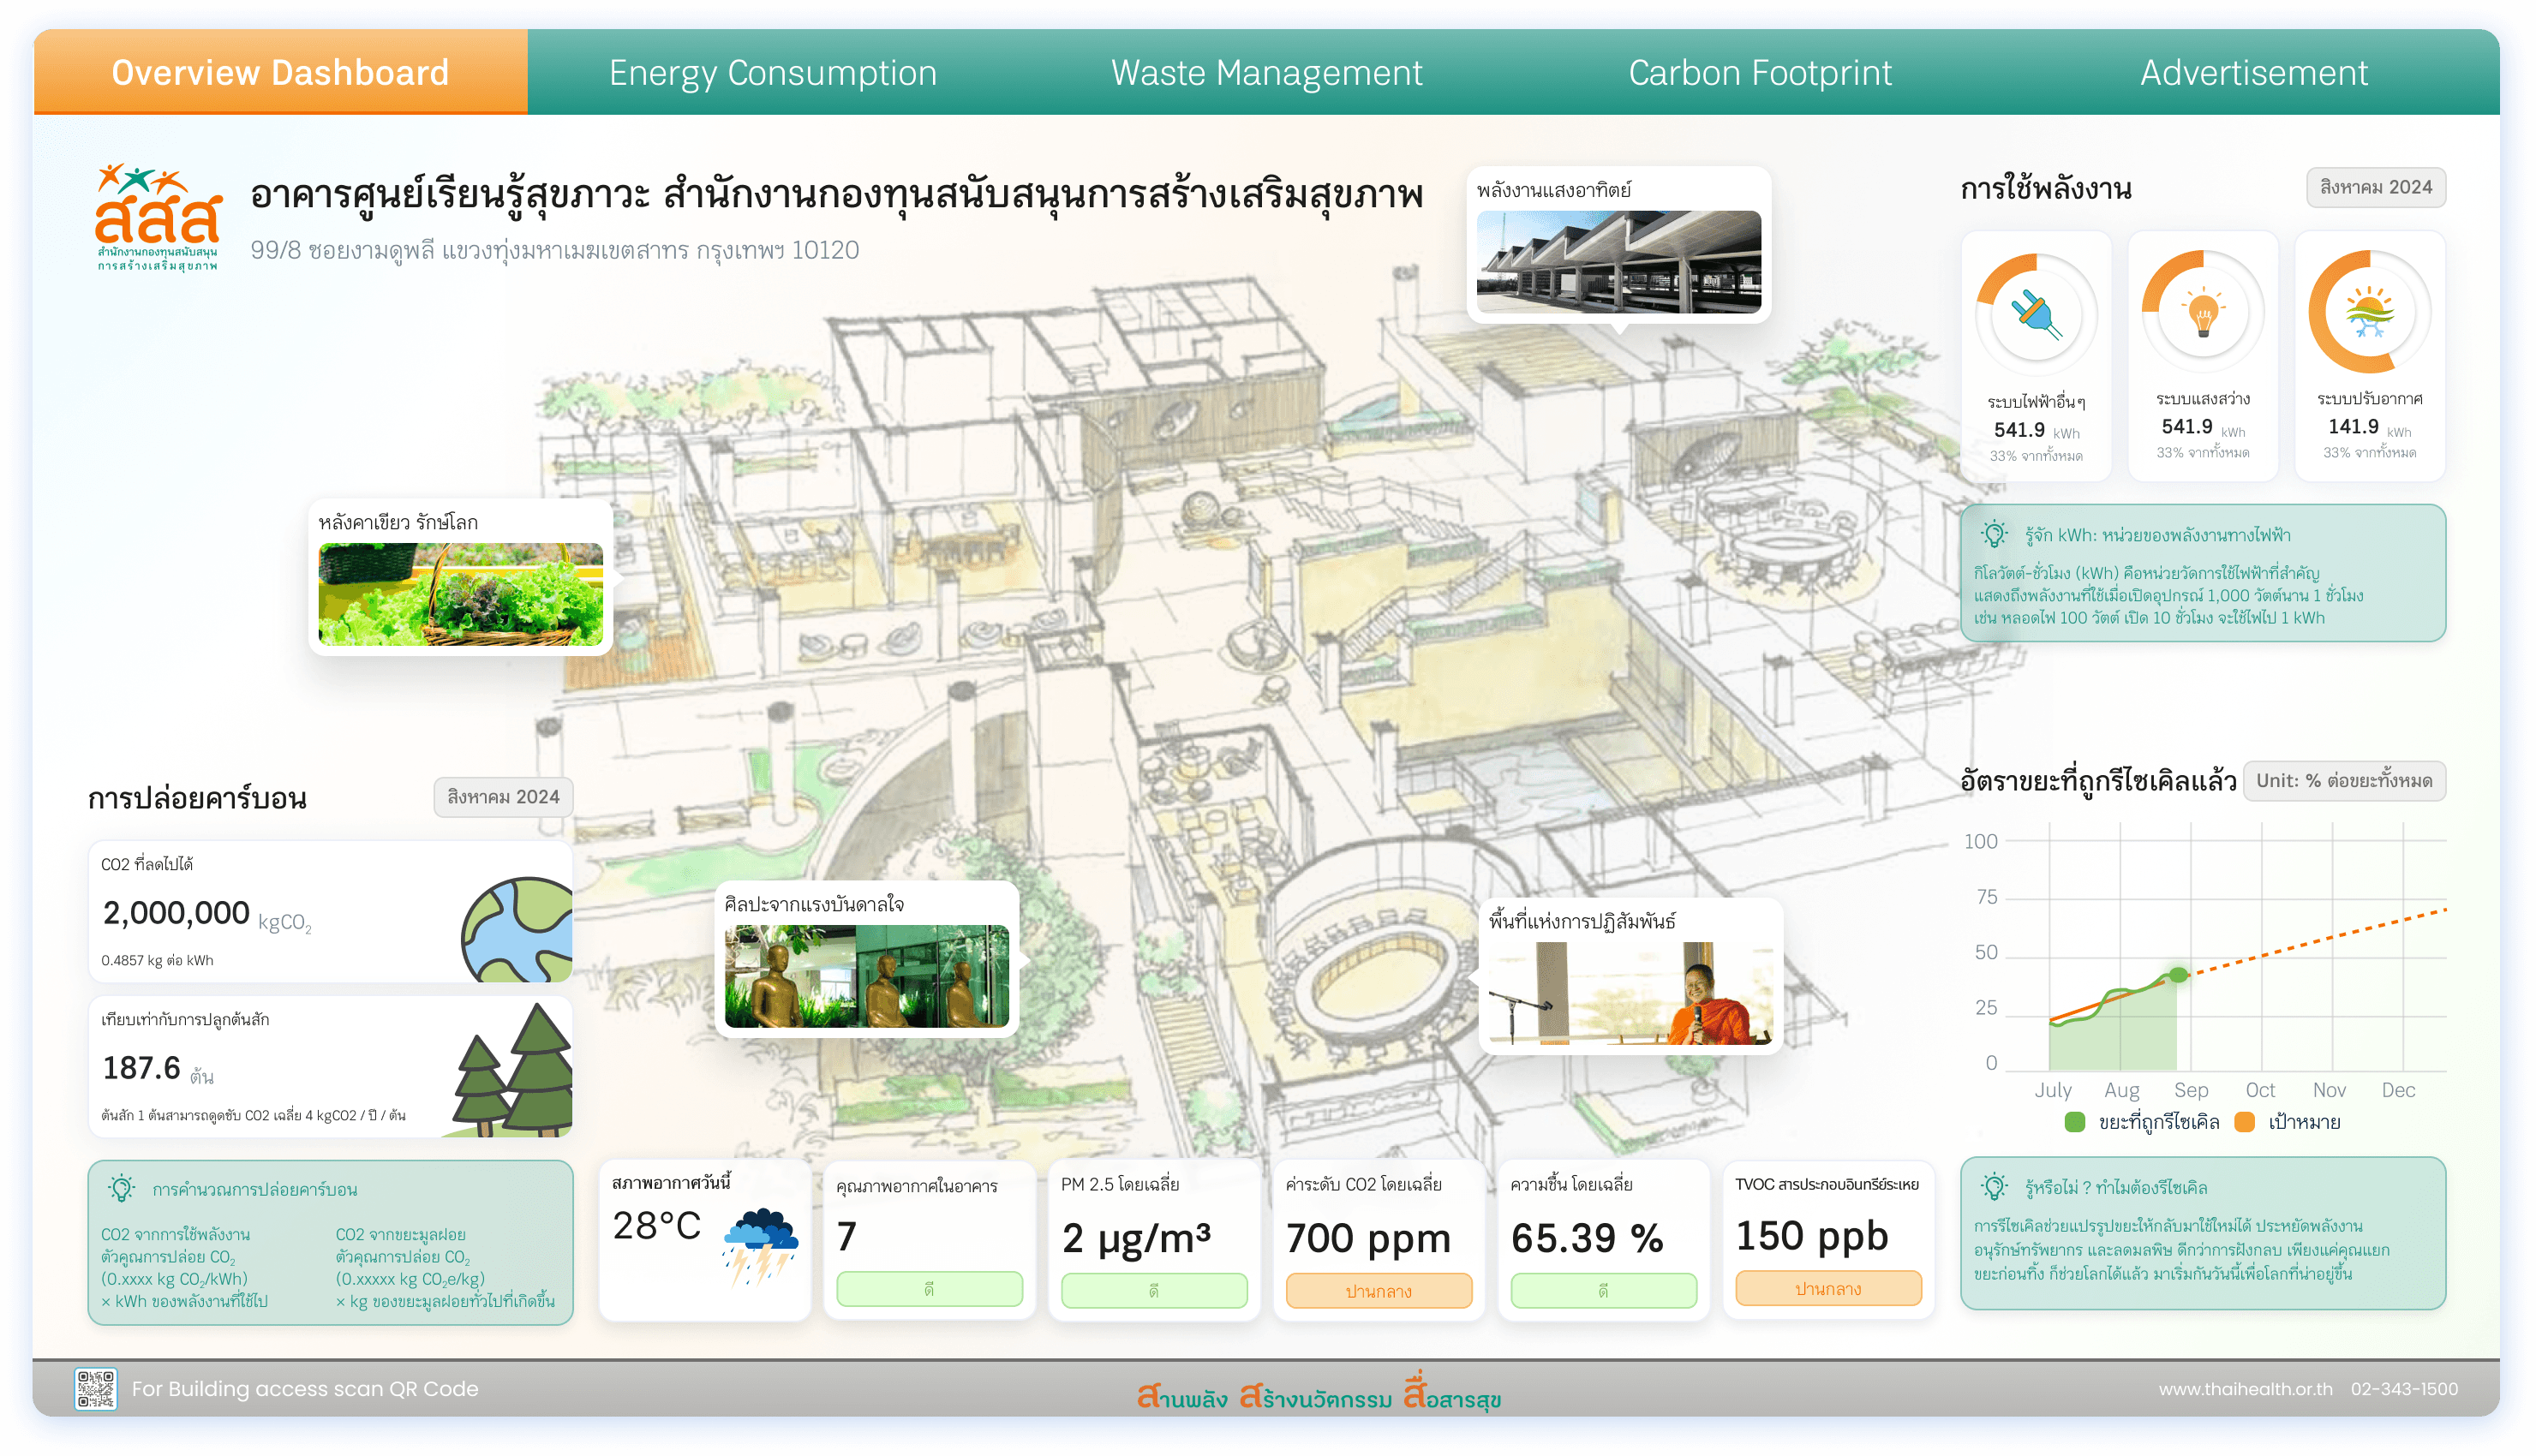
This interactive dashboard empowers users to monitor energy, waste, and carbon footprint metrics in real time, optimizing resource management and enhancing sustainability efforts across the facility.
Enhanced Data Visualization
The dashboard provides a detailed, interactive layout that allows users to visualize energy consumption, waste management, and carbon footprint across different floors in real time, aiding in better decision-making and tracking progress towards sustainability goals.
Optimized Resource Management
The system shows clear targets for energy reduction, waste management, and carbon footprint, allowing users to implement and monitor sustainability efforts more effectively. Insights into areas for improvement help in maintaining a consistent focus on sustainability initiatives.
Improved Visitor Engagement
The use of clear graphs, color-coded performance indicators, and personalized recommendations makes it easier for visitors and building managers to understand key environmental metrics, motivating them to take actions that align with energy and waste reduction goals.
Location
444 Phayathai Road, Pathumwan District, Bangkok 10330
Property Type
Mixed-use
HVAC Details
Chiller Plant
Client's Challenges
Inspiring IAQ Metrics Representation
The client wanted to present indoor air quality (IAQ) metrics in a visually compelling way.
Educating Users on Sustainability
The goal was to educate visitors and employees on adopting sustainable lifestyles through the building’s systems.
Showcasing Building Sustainability Efforts
The client needed an engaging platform to showcase the building's efforts toward sustainability and environmental performance.
Our Solution
Collaborative Implementation
AltoTech partnered with a GIS Group for this project. While GIS Group handled sensor installation and hardware configuration, AltoTech was responsible for the software development and dashboard creation.
Developed an interactive dashboard that visually represents IAQ metrics and sustainability efforts, aiming to engage and educate visitors on energy-saving and eco-friendly practices.
Implementation Process
1
Requirements Gathering & Project Planning
2 weeks
Worked closely with the client to define goals and outline the project’s scope.
2
Design & Development
8 weeks
Created a user-friendly and visually inspiring software interface to represent IAQ metrics.
3
Integration & Installation
2 weeks
Integrated the developed software with the installed sensors and completed the system setup.
4
Testing & Documentation
2 weeks
Conducted thorough testing and prepared documentation to ensure the system's smooth operation.
5
User Training
1 week
Provided training for the client’s staff to ensure effective use of the platform.
Related Cases
Mixed-use
Transforming VENCO Facility Management with Data-Driven Efficiency
VENCO improved energy efficiency, streamlined operations, and reduced manual tasks by using Alto Multi-property solution.
Educational
Revolutionizing Chulalongkorn Campus Operations with AI-Powered Solutions
Chulalongkorn University, one of Thailand's premier educational institutions, embarked on a transformative journey to become a "smart campus".
Mixed-use
MBK Transforms Chiller Plant Efficiency with AI-Driven Optimization
MBK's mixed-use facility achieved 5M THB in annual savings, streamlined reporting, and improved tenant satisfaction by implementing solutions for chiller plant.

