

Property Type
Outcomes
Setting energy, water, and carbon targets is straightforward. Knowing whether you're actually hitting them — across dozens of properties, throughout the year — is a different problem entirely. Most building teams rely on end-of-month reports to discover they've already missed a target, leaving no time to act. Without continuous visibility into performance trends and trajectory, corrective action always comes too late.
The gap isn't in the goals. It's in the real-time awareness to defend them.
KPI Target Tracking is a portfolio-level performance monitoring application that transforms raw building data into clear, actionable performance insights. It gives real estate owners, hotel operators, and facility managers live visibility into how each property tracks against energy reduction, solar generation, water efficiency, and ESG targets — all in one unified dashboard.
The app supports a structured drill-down from property portfolio → individual property → subsystem level, connecting high-level KPI monitoring directly to operational root causes. Whether you manage 5 or 500 properties, KPI Tracking provides a clear, data-backed pathway toward measurable energy savings and carbon reduction.
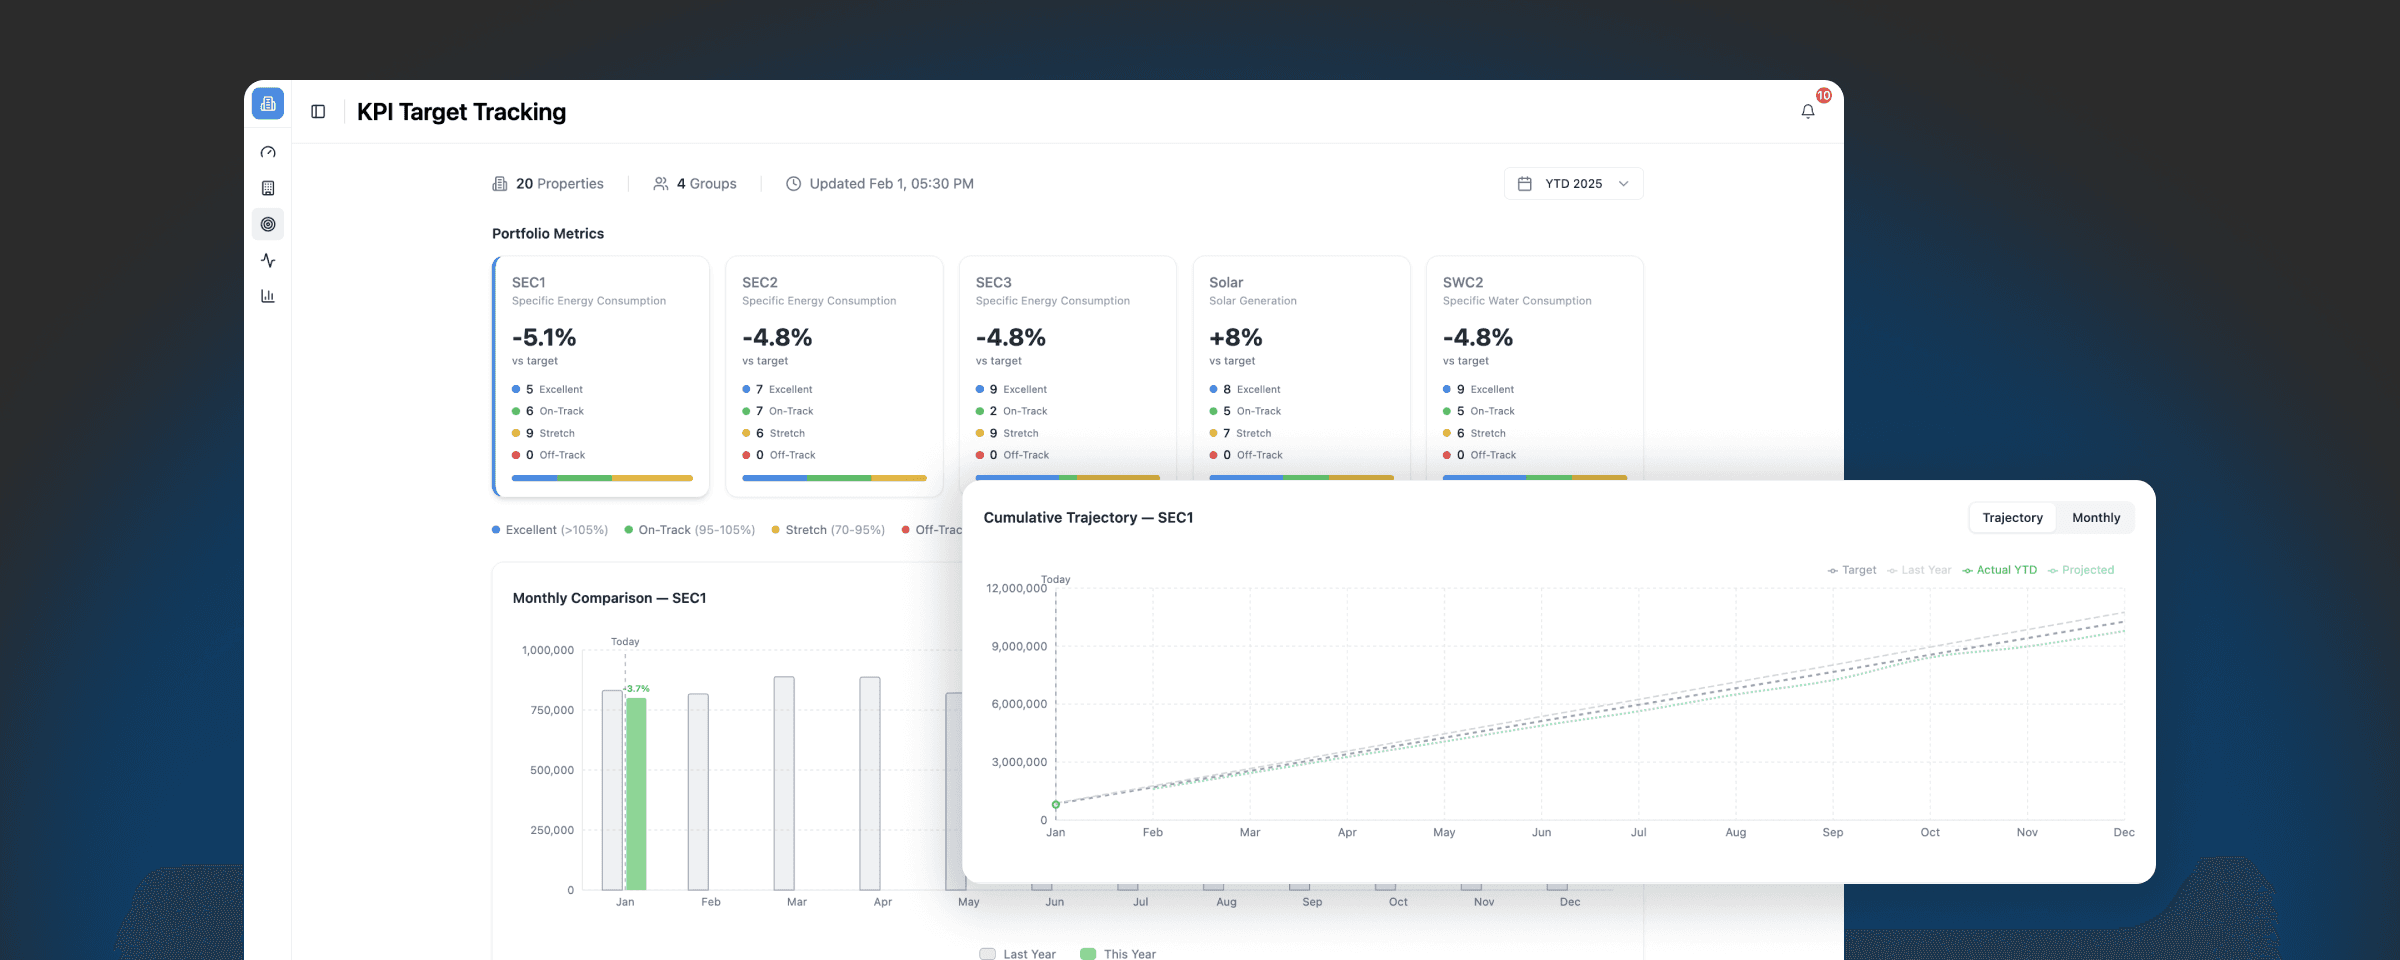
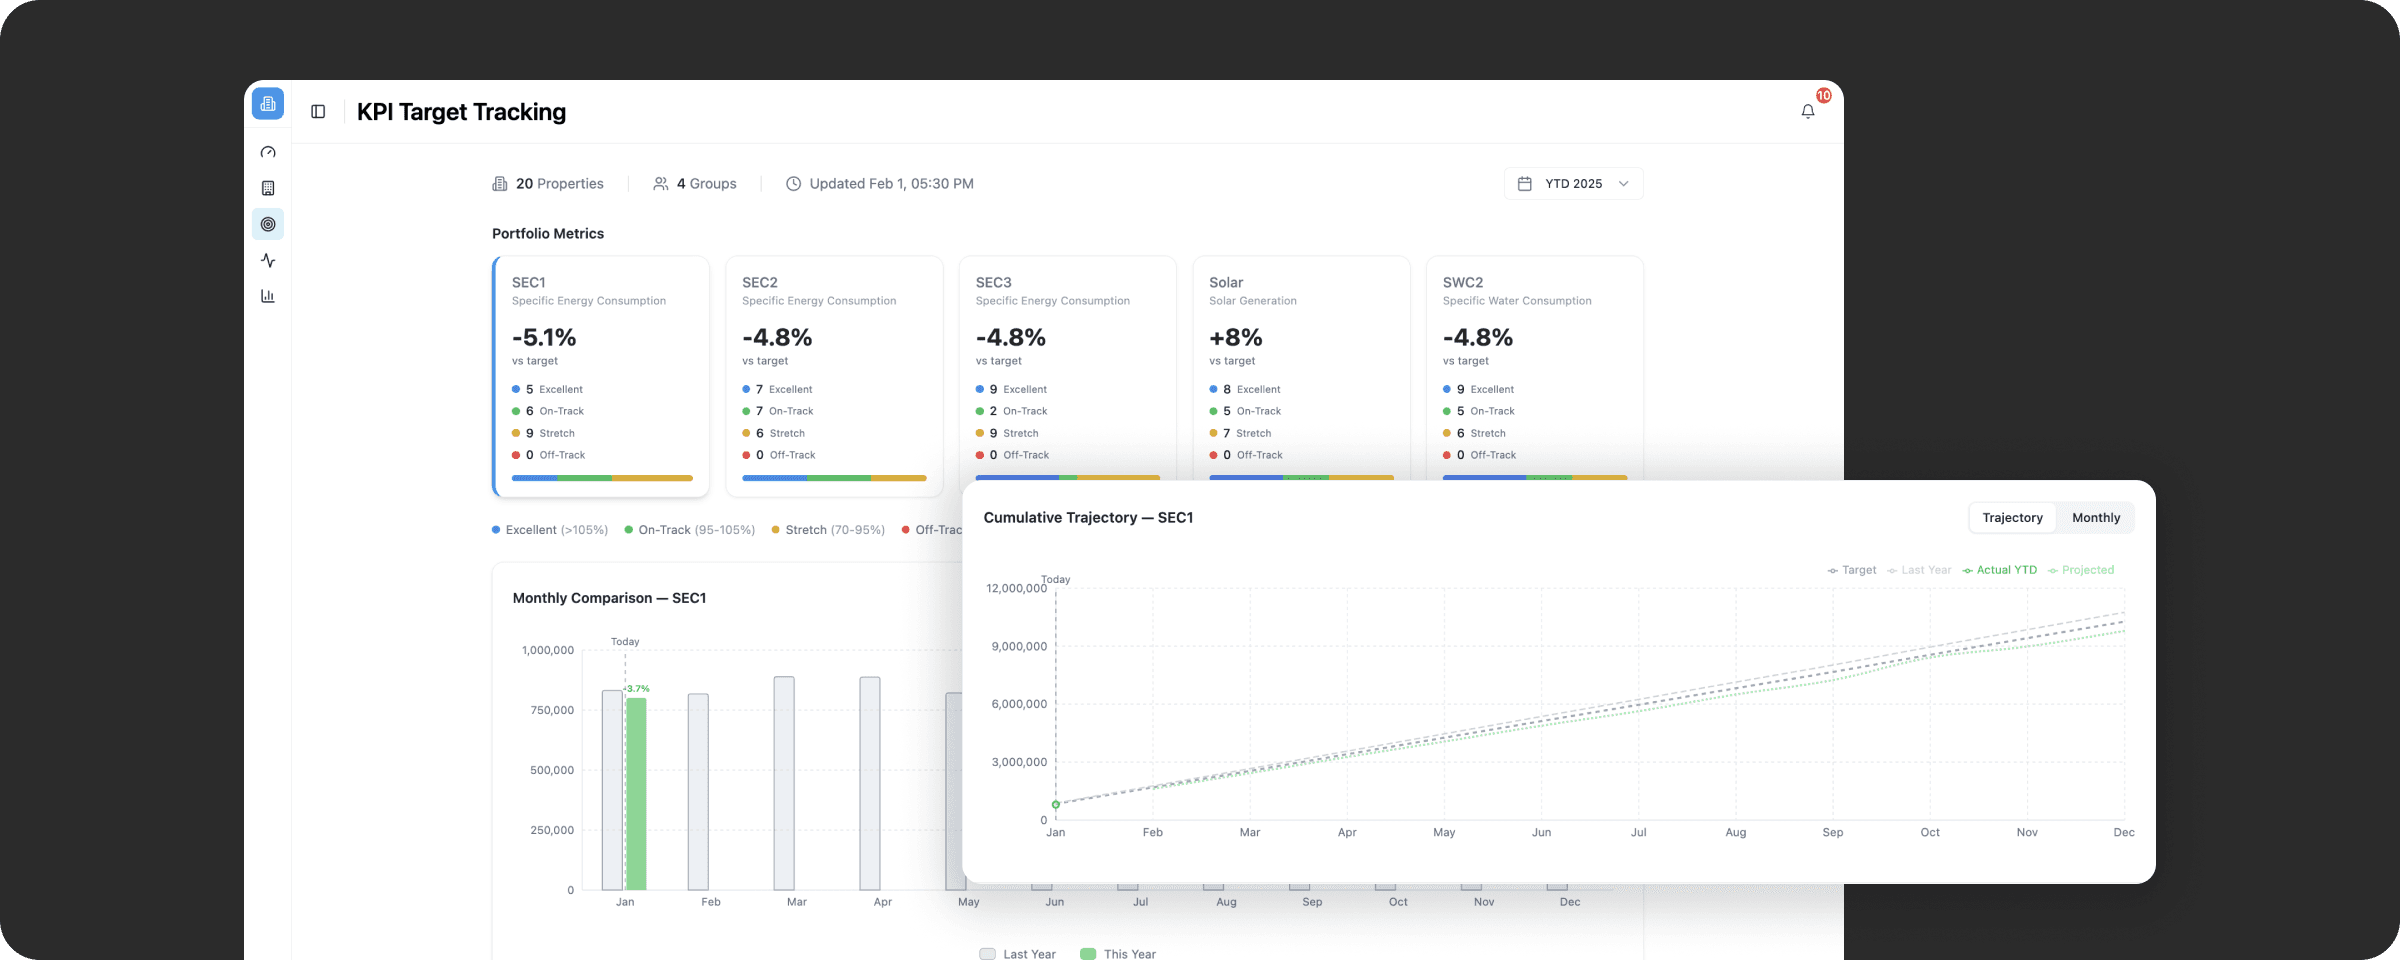
Portfolio-Wide KPI Overview
Monitor key metrics across the entire portfolio — including Specific Energy Consumptions, Solar Generation, and Water Consumption. Each metric displays percentage vs. target, on-track / off-track classification, and property count breakdown by region or group.
Cumulative Trajectory & Year-End Forecast
Track actual year-to-date performance against last year's baseline and your annual target, with a projected year-end outcome. Know immediately whether you are on course to meet sustainability and Net Zero commitments — not just where you stand today.
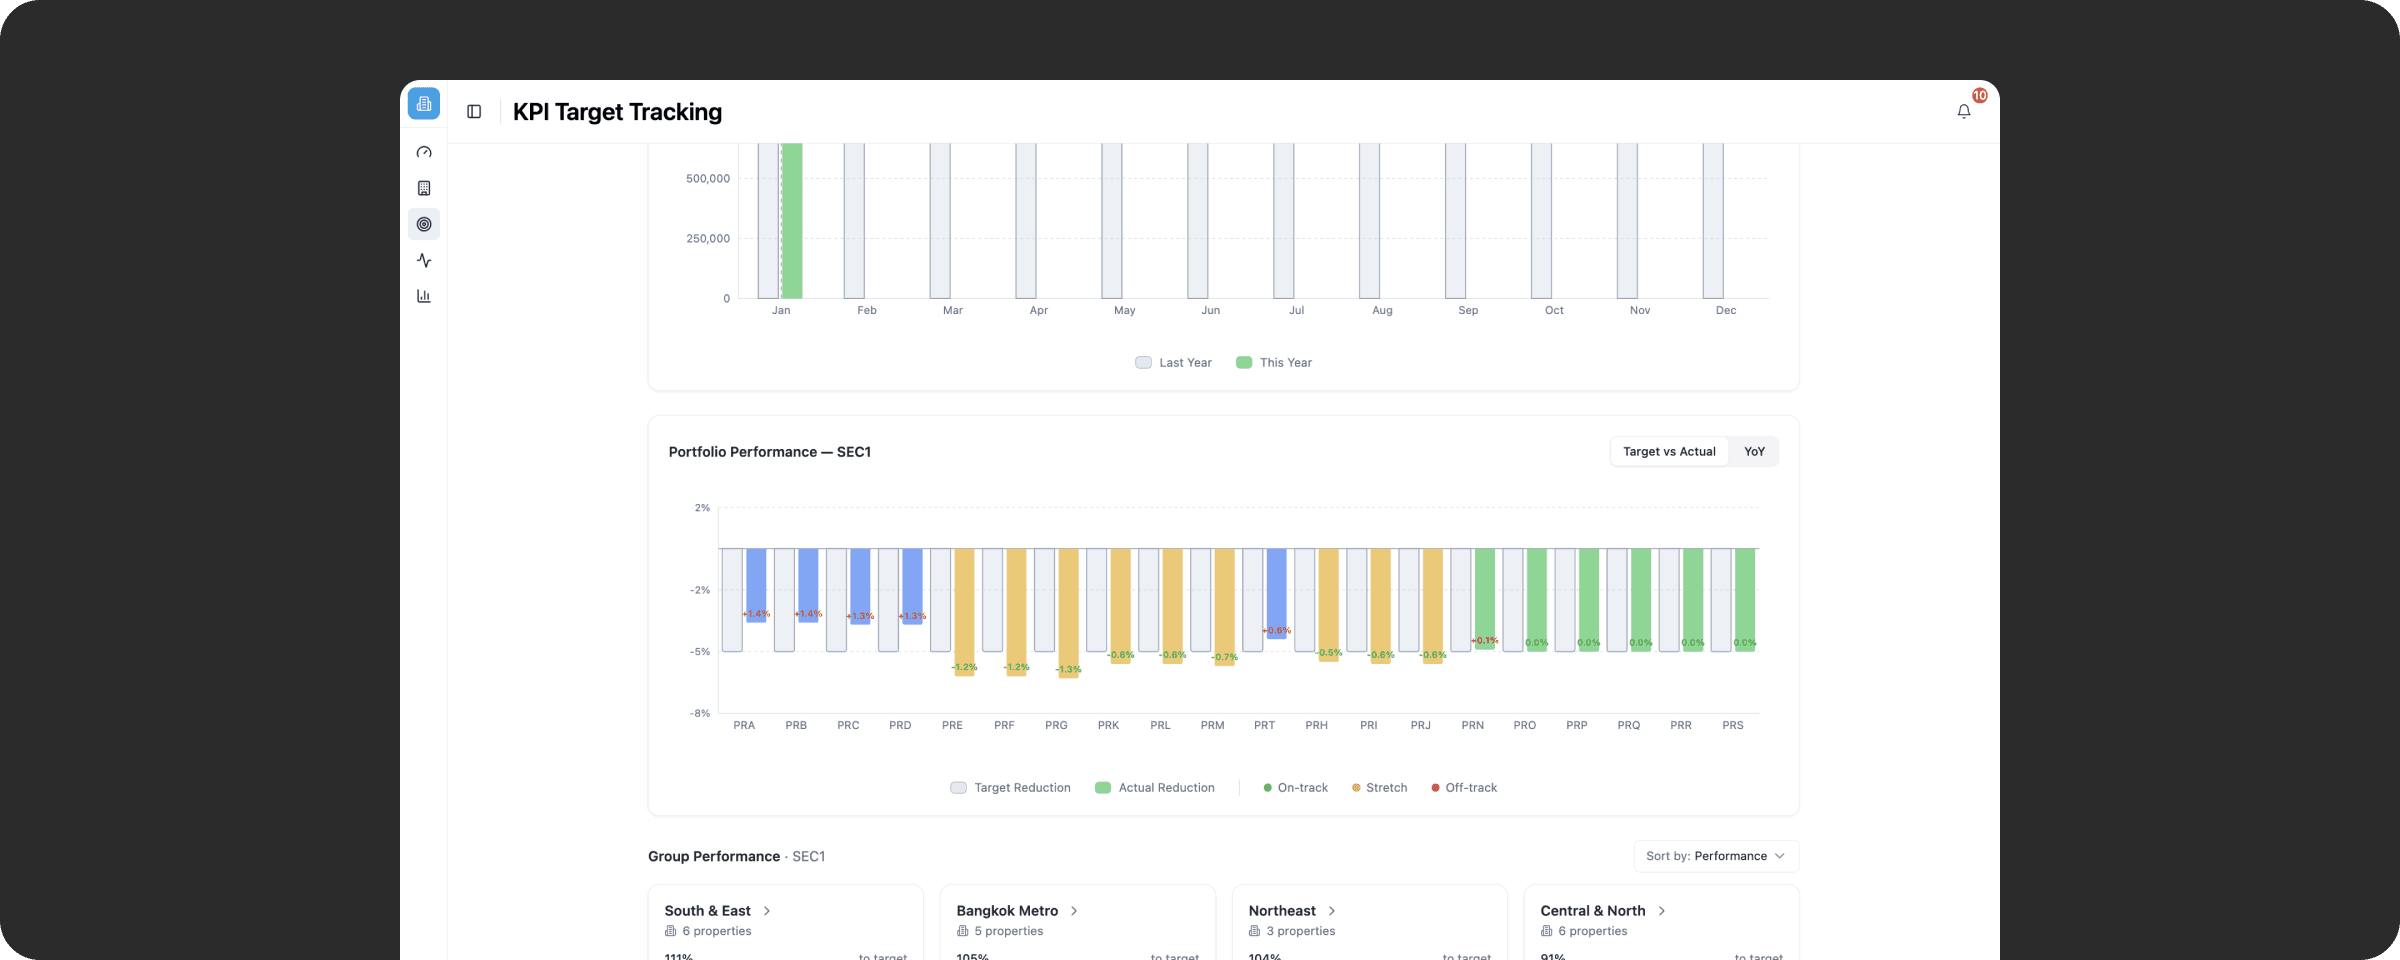
Portfolio Performance Breakdown
Compare year-over-year target reduction vs. actual reduction across all properties, with color-coded performance bands that instantly highlight underperforming assets and surface strategies from your best performers.
Drill-Down to Subsystem Level
Navigate from a portfolio view into a single property, then further into specific subsystems such as EMS, Chiller Plant, HVAC Airside, Sanitary, etc. This structured flow connects a high-level KPI gap directly to its operational root cause — enabling precise, targeted interventions.
Before & After Equipment Comparison
Compare equipment performance across two date ranges side by side — with efficiency, energy, and peak demand variance calculated automatically and exportable as PDF for reporting and ROI conversations.
Top Properties trust AltoTech to make their building smart


FAQs
How does this help reduce hotel electricity bills?
Is this just reporting, or does it drive action?
Can this support ESG and Net Zero strategy?
Turn your portfolio data into measurable energy and ESG results.
Start tracking smarter with KPI Tracking – your foundation for AI-powered Energy Management System Thailand.
☑️ Catch Target Deviations Before It's Too Late
Year-end forecasting gives teams a forward-looking view rather than a current snapshot — enabling corrective action while there's still time to change the outcome.
☑️ Eliminate End-of-Month Surprises
Continuous KPI monitoring replaces reactive monthly reporting. Gaps are visible the moment they emerge, not after the period has already closed.
☑️ Connect Portfolio Goals to Operational Action
The subsystem drill-down links an off-track KPI directly to its root cause — whether that's inefficient chiller sequencing, poor ventilation control, or an unresolved AFDD fault — so teams know exactly where to intervene.
☑️ Strengthen ESG Reporting & Sustainability Disclosure
Centralized, data-backed KPI tracking supports ESG reporting requirements, executive sustainability dashboards, and annual energy planning — giving asset managers and ESG teams a reliable foundation for sustainability disclosures.
☑️ Scale Oversight Without Adding Headcount
A single supervisor can monitor target adherence across an entire portfolio without manual data pulls or site-by-site reporting, with property rankings and health scores making performance gaps immediately visible.